Devtools
Cerebral comes with a powerful debugger that helps you understand your application state and how it changes over time.
Installing the Debugger∞
Download the Cerebral Debugger for your operating system:
- Mac: cerebral-debugger-x.x.x.dmg
- Windows: cerebral-debugger-setup-x.x.x.exe
- Linux: cerebral-debugger_x.x.x_amd64.deb
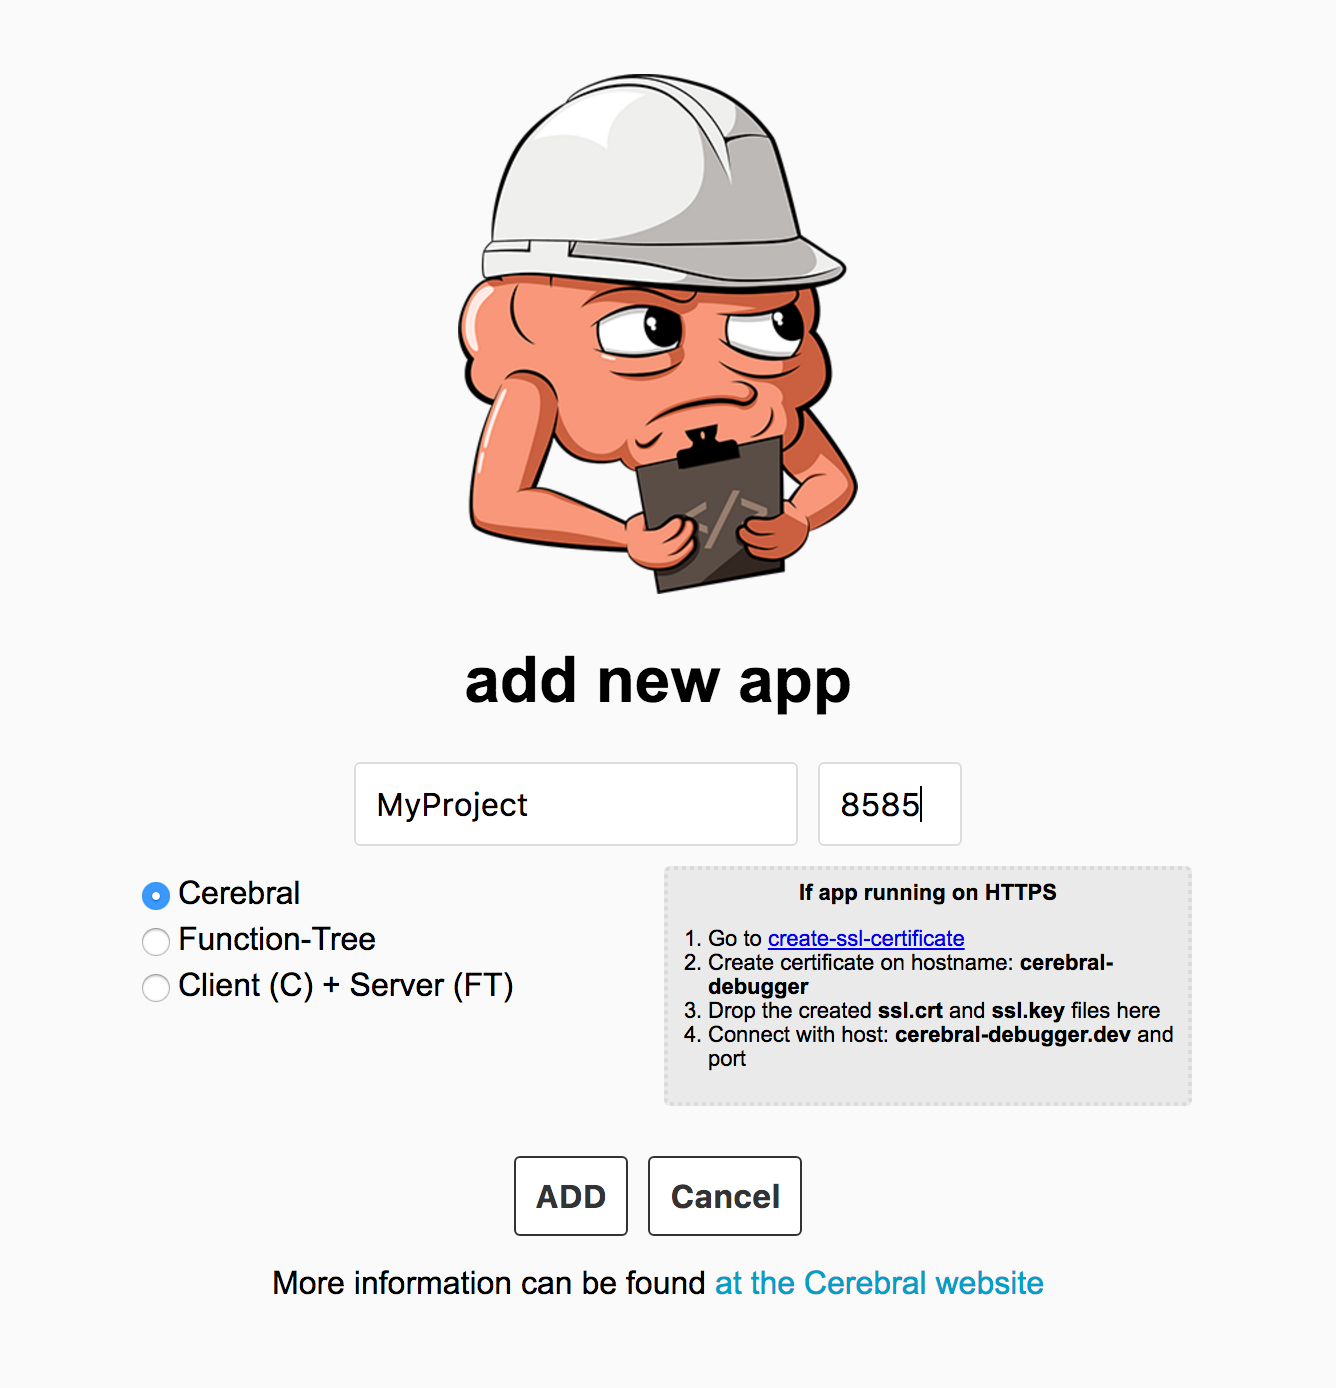
After installation, open the application and create a new debugger instance.

Connecting Your App∞
To connect your application to the debugger, add the devtools to your app configuration:
import { App } from 'cerebral'
import Devtools from 'cerebral/devtools'

const app = App(
  {
    state: {
      title: 'My Project'
    }
  },
  {
    devtools:
      process.env.NODE_ENV === 'production'
        ? null
        : Devtools({
            host: 'localhost:8585' // Default debugger address
          })
  }
)
For native applications or when developing on a different machine than the debugger, use your actual IP address instead of “localhost”.
Using the Debugger∞
Once connected, the debugger provides several powerful features:
State Tab∞
The State tab shows your current application state tree. You can:
- Explore the complete state tree
- See which components are watching specific state paths
- Edit state values in real time to test UI changes
- Search for specific state paths or values

Sequences Tab∞
The Sequences tab lets you monitor sequence executions:
- See a list of executed sequences
- View the full execution path of each sequence
- Inspect input and output values for each action
- See timing information for performance analysis

History & Time Travel∞
The debugger automatically records state changes, enabling time travel debugging:
- Scrub through your application’s history
- Jump to any previous state
- See what sequences and actions led to specific state changes
Time travel temporarily freezes your app from executing new sequences when you’re viewing past state. Return to the present to resume normal operation.
Components Tab∞
The Components tab helps you understand component relationships:
- See all components watching state
- View component render count for optimization
- Identify components with too many dependencies
Debugging Tips∞
1. Use Named Actions∞
Named actions make it easier to understand sequence execution:
// Instead of:
;[
  ({ store }) => store.set(state`isLoading`, true),

  // Use:
  function setLoadingTrue({ store }) {
    store.set(state`isLoading`, true)
  }
]
You can also use the sequence factory to create named sequences for better debugging:
import { sequence } from 'cerebral/factories'

// Named sequence appears in debugger
export const fetchItems = sequence('Items - Fetch', [
  setLoadingTrue,
  httpGet('/api/items'),
  set(state`items`, props`result`),
  setLoadingFalse
])
2. Structure Your State Logically∞
Well-organized state makes debugging easier:
// Instead of flat state:
{
  userFirstName: 'John',
  userLastName: 'Doe',
  userAge: 30
}

// Group related data:
{
  user: {
    firstName: 'John',
    lastName: 'Doe',
    age: 30
  }
}
3. Use Development-Only Debugging∞
Add debugging-specific code that only runs in development:
function debugAction({ props, store }) {
  if (process.env.NODE_ENV !== 'production') {
    console.log('Props received:', props)
  }

  // Normal action logic
  store.set(state`user`, props.user)
}
Production Considerations∞
Always disable devtools in production by using environment checks:
devtools: process.env.NODE_ENV === 'production'
  ? null
  : Devtools({
      host: 'localhost:8585'
    })
For more advanced configuration options, see the Devtools API documentation.